Tableau Projects
My collection of hands‑on data projects in Excel, SQL, Python, Tableau and Power BI.

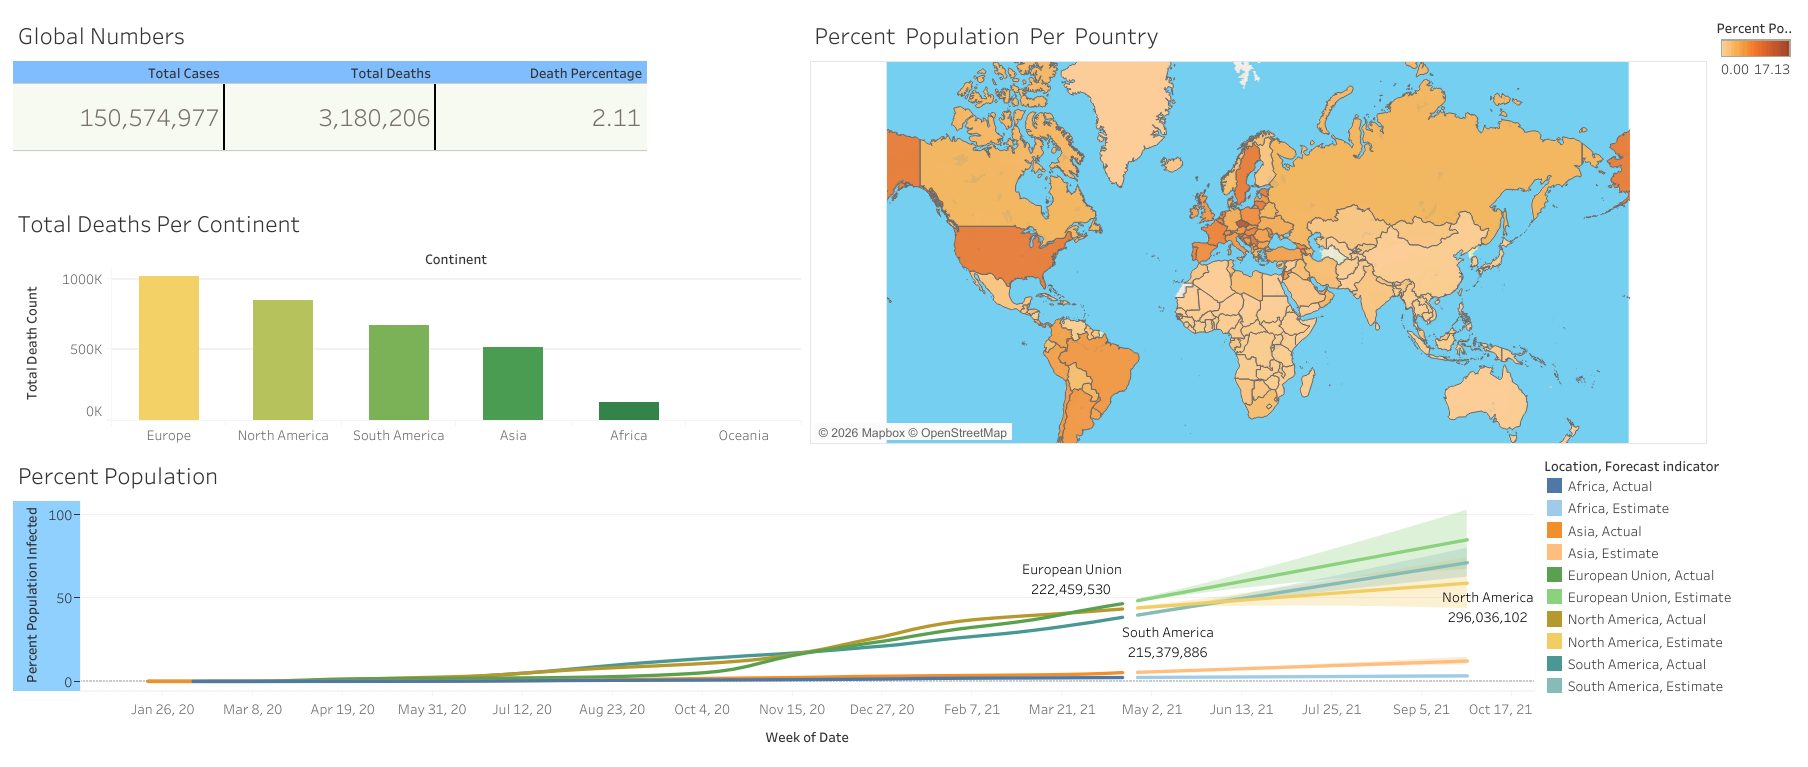
This project involves a comprehensive exploration of global COVID-19 data, focusing on infection rates, mortality statistics, and vaccination progress across different countries and continents. The goal was to transform raw data into actionable insights using advanced SQL techniques.

This project focuses on the Data Cleaning phase of the data analysis process. Using a dataset containing housing information from Nashville, TN, I performed various SQL queries to transform raw, "dirty" data into a clean, structured format ready for analysis. Data cleaning is often the most time-consuming part of a data scientist's job, and this project demonstrates my ability to handle inconsistencies, null values, and poorly formatted strings using T-SQL.
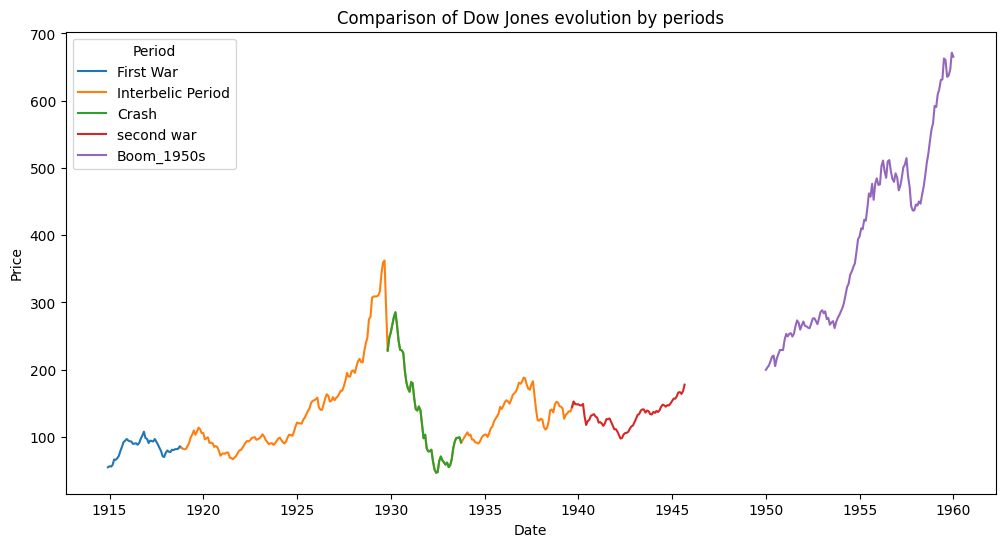
This project is a comprehensive statistical analysis of the American Dow Jones Index, covering over five decades of historical data. It was developed to showcase advanced Python data analysis skills, specifically focusing on data manipulation, normalization techniques, and professional reporting inspired by official statistical standards (e.g., National Institute of Statistics style).

Donec eget ex magna. Interdum et malesuada fames ac ante ipsum primis in faucibus. Pellentesque venenatis dolor imperdiet dolor mattis sagittis magna etiam.

Donec eget ex magna. Interdum et malesuada fames ac ante ipsum primis in faucibus. Pellentesque venenatis dolor imperdiet dolor mattis sagittis magna etiam.

Donec eget ex magna. Interdum et malesuada fames ac ante ipsum primis in faucibus. Pellentesque venenatis dolor imperdiet dolor mattis sagittis magna etiam.